Visualize FASS Research
What research goes on in the Faculty of Arts and Social Sciences? The simple answer is: a lot! These visual representations of our research can help you get a handle on the knowledge being gained throughout the FASS.
Each of the tabs below will take you to a different interactive visual representation. Where you start is going to depend on what questions you have about what we do.
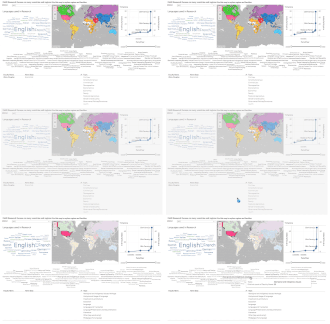
On the Map of Research Regions you can click on any country, or continent, and see the FASS faculty doing research on that region, along with the research topics they focus on. We’ve also included a tool that allows you to hone in on a particular time period.
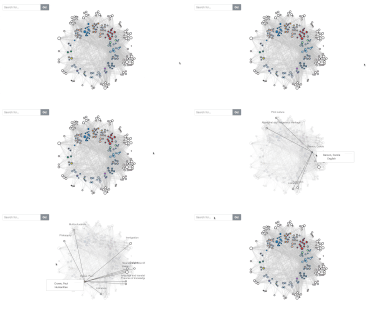
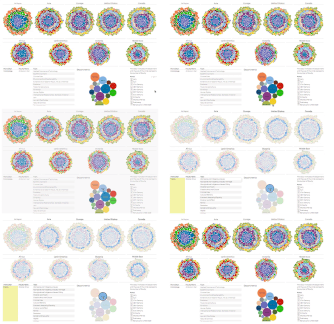
The Research Web hones in on faculty members and their research topics. You can see easily the topics a faculty member is working on, and also see the range of faculty across disciplines working on a topic.
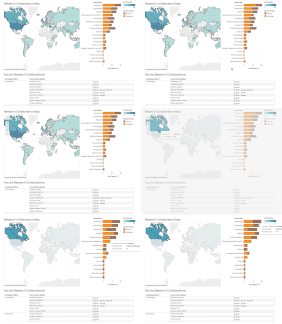
FASS faculty collaborate with researchers around the world. Collaborations shows you just how extensive our research networks are on a simple interactive map.
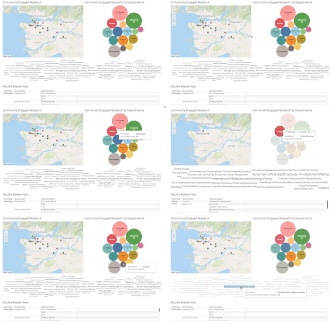
On a map of the Lower Mainland, you can see the Community partners impacted by FASS research going on in FASS (Note: the information here is just a snapshot of our community partners. We are working to have more complete information.)
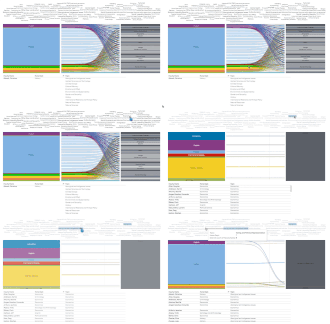
Through Topic Streams you can click on a topic you are interested in, see which units in FASS focus on that topic, and find the particular faculty members working on those topics.
Topic Clusters shows the topics our researchers are working on by geographic region, and by department.
And as you play around with these visualisations, you may find yourselves asking all sorts of questions about the research going on in FASS. Please ask us! You can pose your questions, whatever they are, and send us comments, at Questions .
Credits tells you who did this amazing work. FASS wants to thank the Vancouver Institute of Visual Analytics here at SFU for all their support.
Note: The visualizations here only include the responses to the FASS research survey, and so are not complete. The survey will be conducted annually in September, and the visualizations will be updated with the new information.
